1Ptai
Productivity Data Analytics
Learn More
Discover what Mermaid Chart is and how to use it effectively in 2025. We'll explore its features and see how it stacks up against other project management tools.
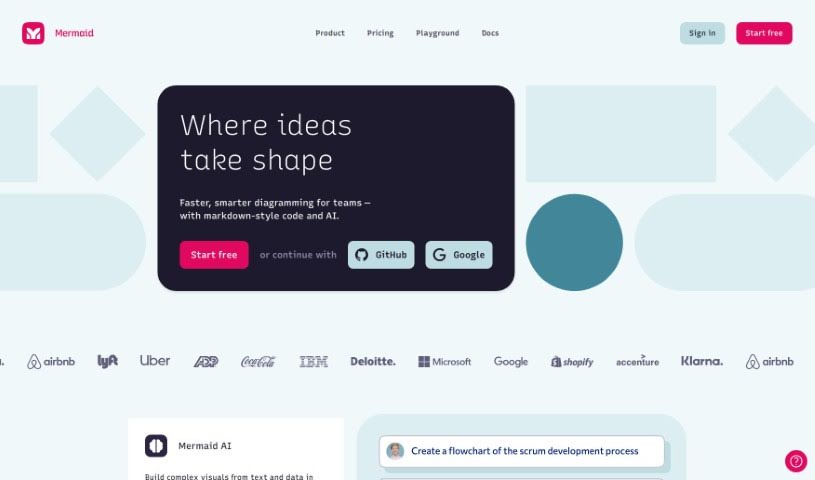
Mermaid Chart is a platform that lets you create diagrams using text. It’s built on the popular Mermaid open-source project. It is a way to document code, make team projects run smoother, and visualize complicated ideas, all with a little help from AI. They’ve recently added Mermaid AI, which is a real game-changer. It helps you create diagrams super fast just by typing in what you want. This means you can get clear visual representations quickly, without wrestling with complicated tools that take ages to figure out.
The team behind the Mermaid open-source project is the same one that created Mermaid Chart. This project is pretty well-known for its collaborative, text-based diagramming, boasting over 61,000 stars on GitHub. The company focuses on making code documentation easier, improving how teams work together, and using AI to create visual representations of complex concepts.
Using Mermaid Chart is pretty straightforward. Here’s a quick rundown:
By following these steps, you can really make the most of Mermaid Chart to create diagrams that are not only informative but also visually appealing for your projects.
Discover more tools in similar categories that might interest you
Get weekly updates on the latest AI tools, trends, and insights delivered to your inbox
Join 25,000+ AI enthusiasts. No spam, unsubscribe anytime.