1Ptai
Productivity Data Analytics
Learn More
Discover what Latitude is and how to use it effectively in 2025. Explore its features and see how it stacks up against other documentation tools.
Latitude is a workspace built specifically for data analysts. Its main goal is to make your workflow smoother and boost how well your team collaborates. It is a tool that simplifies everything from gathering data to figuring out what it all means. It brings together data modeling, report building, and collaboration features into one easy-to-use place. With Latitude, analysts can really speed up their work. You can connect to different data sources, use a huge, collaborative canvas for your work, and even build interactive data apps without getting bogged down in the usual complexities of data analysis.
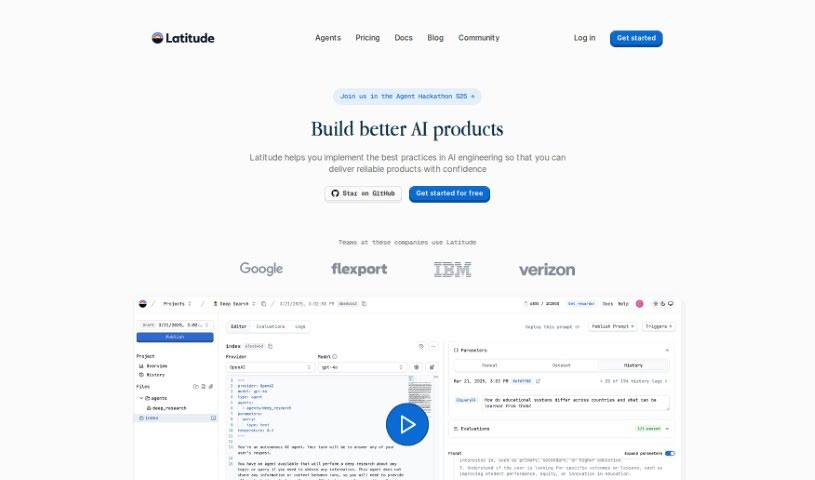
Key features include a streamlined workflow, easy integration with various data sources, a collaborative canvas where you can transform data and create charts together, a built-in AI assistant that can write SQL queries for you from simple English commands, and the ability to create interactive data apps for your team to use.
Latitude was developed by an Open-Source Prompt Engineering Platform. This platform itself offers a range of features designed to help with prompt management, collaborative workspaces, custom logic, version control, and various SDK integrations. Essentially, it’s built to simplify data analysis workflows for analysts by bringing together data modeling, report building, and collaboration into a single, user-friendly environment.
Latitude really simplifies and speeds up the entire workflow, from collecting data to generating insights, especially for data analysts. It brings together data modeling, report building, and collaboration in a way that’s easy to use. You get integration with various data sources and the ability to quickly build interactive data apps. This helps analysts work more efficiently and unburden themselves from complex data analysis tasks. It streamlines the process, allowing a quick transition from raw data to reporting, and provides that collaborative canvas for adding data sources, transformations, and charts all in one place. The built-in AI assistant is great for generating performant SQL queries from plain English, and you can easily build stunning dashboards and reports with annotations for collaboration.
Getting started with Latitude is pretty straightforward. Here’s a simple breakdown of the steps:
By following these steps, you can really make the most of Latitude’s capabilities. It’s a great way to streamline your data analysis processes and boost collaboration within your team.
Discover more tools in similar categories that might interest you
Get weekly updates on the latest AI tools, trends, and insights delivered to your inbox
Join 25,000+ AI enthusiasts. No spam, unsubscribe anytime.