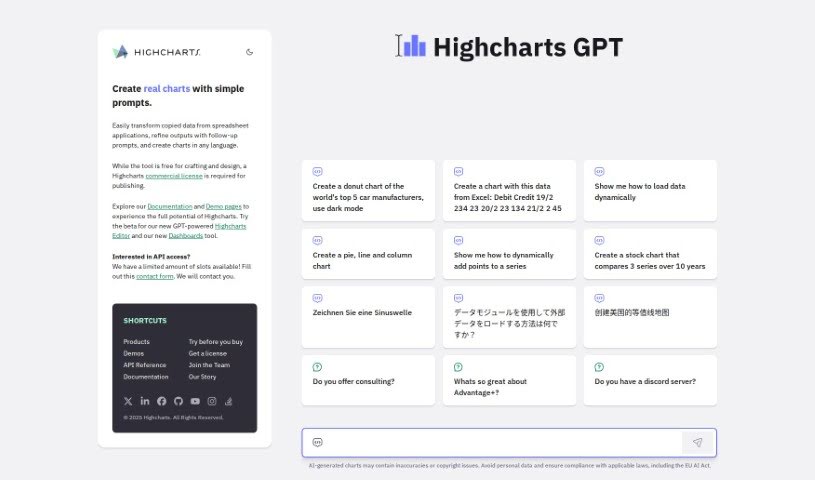
What is Highcharts GPT?
Highcharts GPT is a really neat tool that brings together data visualization with conversational AI, all thanks to ChatGPT. It’s a top-notch solution for creating charts, offering a solid core library packed with all sorts of chart types. You can make eye-catching line and bar charts, insightful pie charts, specialized stock charts, maps, and even Gantt charts. It is your all-in-one spot for anything data visualization. Plus, it comes with handy add-ons like the super user-friendly Highcharts Editor and Highcharts Advantage for excellent support. It integrates smoothly with major development environments like Android, Angular, iOS, and JavaScript, making it easy to use no matter what you’re working on. You can also keep up with the latest updates, dive into tons of documentation and API references, and really fine-tune your data visualizations.
Who created Highcharts GPT?
Highcharts GPT was actually created by Torstein Hønsi. He’s one of the co-founders of Highsoft, a Norwegian software company that’s really well-known for its data visualization products. Torstein is a seasoned software developer and entrepreneur who’s passionate about building innovative ways to visualize data. Highsoft got its start back in 2002 and has built a strong reputation in the industry for providing high-quality charting libraries, like Highcharts GPT, which serve a wide range of business needs all over the world.
What is Highcharts GPT used for?
- Upgrade your charting experience: Use intuitive add-ons like the Highcharts Editor and Highcharts Advantage for top-tier support.
- Seamless integration: It works smoothly with major development environments, including Android, Angular, iOS, JavaScript, and many others.
- Stay current: Keep up with the latest updates, such as Highcharts for Python.
- Full customization: Dive into extensive documentation and API references to tailor your data visualizations exactly how you want them.
- Diverse chart types: Implement captivating line and bar charts, insightful pie charts, and specialized stock charts, maps, and Gantt charts.
- Learn from others: Discover how organizations have successfully used it by checking out their case studies.
- See what’s coming: Access a detailed roadmap to stay informed about future enhancements.
- Natural language charting: Create charts simply by having conversations with ChatGPT.
- Easy chart creation: Use the Highcharts Editor for straightforward chart building.
- Broad compatibility: It integrates seamlessly with major development environments like Android, Angular, iOS, JavaScript, and more.
- Get support: Access the Highcharts Advantage program, along with in-depth documentation and API references for all your support needs.
- Implement various charts: You can create line, bar, pie, stock, maps, Gantt charts, and more.
- Customize with resources: Make your data visualizations your own using the wealth of information in the documentation and API reference.
- Boost your charting: Enhance your charting experience with Highcharts for Python.
- Plan for the future: Keep informed about future improvements through the detailed roadmap.
- Visualize data effectively: Use data visualization to support your project needs across many different industries.
- Comprehensive charting library: It offers a wide array of both standard and specialized chart types.
- ChatGPT integration: Create charts using natural language conversations.
- User-friendly tools: Tools like the Highcharts Editor make chart creation easy.
- Extensive integrations: Works smoothly with major development environments like Android, Angular, iOS, JavaScript, etc.
- Support and resources: Get help through the Highcharts Advantage program, documentation, and API reference.
- Latest updates: Stay informed about new features like Highcharts for Python.
- Proven implementations: See how it’s been successfully used by various organizations in case studies.
- API customization: Customize your data visualizations using the API reference.
- Future roadmap: Future improvements and updates are clearly laid out in the detailed roadmap.
- Conversational charting: Create charts using natural language conversations.
- Simple chart creation: The Highcharts Editor makes creating charts easy.
- Wide integration: Seamlessly integrates with major development environments like Android, Angular, iOS, JavaScript, and more.
- Advantage program: Access the Highcharts Advantage program for support and resources.
- Complete charting solutions: Implement comprehensive charting solutions for all your data visualization needs.
- Intuitive add-ons: Upgrade your charting experience with intuitive add-ons.
- Rich resources: Utilize the wealth of resources from extensive documentation and API reference.
- Roadmap awareness: Stay informed about future enhancements with the detailed roadmap.
- Case study examples: See successful implementations by organizations in case studies.
- Advanced chart types: Includes line, bar, pie, stock, maps, and Gantt charts, among others.
Who is Highcharts GPT for?
- Data Analysts
- Business Intelligence Developers
- Software Engineers
- Product Managers
- Marketing Analysts
- Financial Analysts
- Project Managers
- Educators
- Research Scientists
- UX/UI Designers
How to use Highcharts Gpt?
Here’s a simple guide to using Highcharts GPT:
- Get Started: First, head over to the Highcharts website and find the Highcharts GPT section. It’s a good way to get a feel for what it offers and its features.
- Integrate It: Highcharts GPT offers really smooth integration options for all sorts of development environments, like Android, Angular, iOS, and JavaScript. Just pick the integration that best fits your project to ensure it’s compatible and easy to work with.
- Create Your Charts: You can use the comprehensive charting library that Highcharts GPT provides, which includes a wide variety of standard and specialized chart types. Feel free to create captivating visualizations like line charts, bar graphs, pie charts, Gantt charts, maps, and much more.
- Add Enhancements: Explore handy add-ons like the easy-to-use Highcharts editor and Highcharts Advantage for top-notch support. These really help improve your charting experience.
- Stay Up-to-Date: Make sure to keep up with the latest updates, such as Highcharts for Python. Also, take full advantage of the extensive documentation and API references to customize your data visualizations completely.
- Check Out Success Stories: It’s helpful to learn from other organizations that have successfully used Highcharts. You can do this by looking at their case studies, which are available on the Highcharts website.
- Look Ahead: Stay informed about what’s coming next and upcoming features by checking out the detailed roadmap Highcharts provides.
- Explore More: Make the most of the Highcharts documentation, demo pages, and tools like the Highcharts Editor and Dashboards to really see everything the platform can do.
- API Access: If you’re interested in API access, just fill out the contact form on the Highcharts website. It’s a great way to explore that possibility.
By following these steps, you’ll be able to effectively use Highcharts GPT to create really engaging and insightful data visualizations for all your projects.