What is Vizzy?
Vizzy is a neat AI-powered tool that helps you create data visualizations really fast. You can connect it to OpenAI using an API token, which lets you tap into various AI tools. This means you can visualize all sorts of data, like public health stats, geographical information, legislative updates, media scripts, and much more. Vizzy also makes it easy to collaborate on public projects, and you have the option to keep your projects private too. Just a heads-up, you’re responsible for any costs that come up when you use it. Typically, it costs less than $1 per project, but this can change depending on how you use it and if there are any bugs.
Who created Vizzy?
Vizzy was developed by rbren. It’s an AI-powered tool built for quick data visualization, letting users harness the power of AI tools through OpenAI. The project kicked off on February 8, 2024, as an open-source initiative. There’s also talk of offering it as a paid service down the line. To get the most out of Vizzy for different kinds of data and fields like public health, legislative changes, and media scripts, you’ll need to link your OpenAI account. While the tool really encourages working together on public projects, remember that you’ll be covering the usage costs, which usually stay under $1 per project.
What is Vizzy used for?
Vizzy is super handy for a bunch of things:
- Visualizing public health data: Get a clear picture of health trends.
- Media analysis: Dive into scripts from TV shows or other media.
- Tracking legislative changes: See how laws evolve over time.
- Geographic analysis: Like looking at obesity rates across different states.
- Dashboard creation: Build custom dashboards for all sorts of data.
- Collaboration: Work with others on public projects.
- In-depth visualization: Really dig into complex data to understand it better.
- GitHub contributions: You can help improve the tool by contributing to its development on GitHub.
- User-driven enhancements: Your input is welcome to make Vizzy even better.
- Visualizing geographic data: Explore maps and spatial information.
- Media analysis: Specifically, analyzing scripts from TV shows.
- Understanding obesity rates: See how these rates vary by state.
- Correlations and trends: Spot connections and patterns in your data.
- Supporting data uploads: Easily bring your own files into Vizzy.
- Low-cost visualization: It’s an affordable way to visualize your data.
- Public health information: Visualize data related to public health.
- Analyzing media scripts: Like those from television shows.
- Collaborating on public projects: Team up with others.
- Contributing to GitHub: Help improve the tool’s code.
- Supporting diverse data types: Works with many kinds of data.
- Rapid data visualization: Get your visualizations done quickly.
- Versatile data compatibility: Handles a wide range of data formats.
- Allows collaboration: Makes it easy to work with others.
- Tracks legislative changes: Keep an eye on new laws.
- Analyzes obesity rates geographically: See spatial patterns in health data.
- Media script analysis: Capabilities for examining scripts.
- Supports data file upload: Upload your own files easily.
- Public sharing: All projects are public by default.
- Private project options: Keep sensitive data private.
- Visualize geographic data: Explore spatial data visually.
Who is Vizzy for?
Vizzy is a great tool for:
- Public health professionals: To visualize health data and trends.
- Geographers: For analyzing and visualizing geographic information.
- Legislators: To track changes in legislation.
- Media analysts: To analyze scripts and media content.
- Data Analysts: For general data visualization and exploration.
- Geographic data specialists: For detailed work with spatial data.
How to use Vizzy?
Using Vizzy is pretty straightforward. Just follow these steps:
- Connect to OpenAI: First, you’ll need to get an API token from the OpenAI platform and connect it to Vizzy. This is how Vizzy accesses AI tools.
- Upload Your Data: Next, upload your data files directly into Vizzy. The tool supports various data types.
- Visualize Your Data: Once your data is uploaded, you can start visualizing it. Just pick the type of data you’re working with, whether it’s public health info, geographic data, legislative changes, or even media scripts like those from TV shows.
- Collaborate on Public Projects: Vizzy encourages teamwork! You can allow multiple users to access, edit, and work together on public projects.
- Keep Projects Private: If you have sensitive data, you can make your projects private. By default, though, all projects and data shared with Vizzy are public.
- Contribute on GitHub: Want to help make Vizzy even better? You can suggest improvements or make changes to the codebase directly on Vizzy’s GitHub page.
- Monitor Usage Costs: Keep an eye on your costs. While they’re usually low (under $1 per project), they can vary based on how you use the tool and if any bugs pop up.
- Set Spending Limits: To help manage costs, consider setting spending limits on your OpenAI account that’s linked to Vizzy.
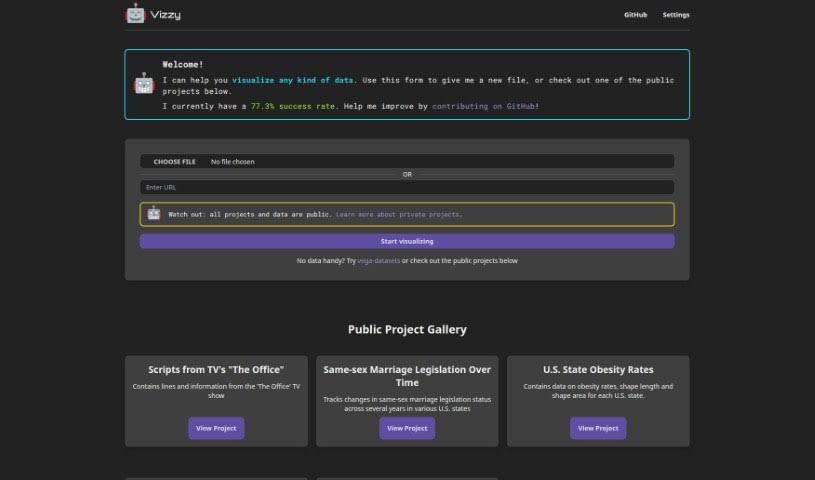
- Explore the Gallery: Check out the Public Project Gallery on the Vizzy website. It’s a great way to see sample projects and understand how Vizzy visualizes different kinds of data, like TV show scripts or legislative changes.
- Get Support or Give Feedback: If you have questions, need support, or want to give feedback, the best place to do that is by opening an issue on the Vizzy GitHub page.
Just remember, you’re responsible for any charges you incur while using Vizzy, and the data you use is generally public. If you’re working with sensitive information, definitely use the private project options. For any sensitive questions or feedback, the GitHub page is the main place to communicate.