
What is Supadash?
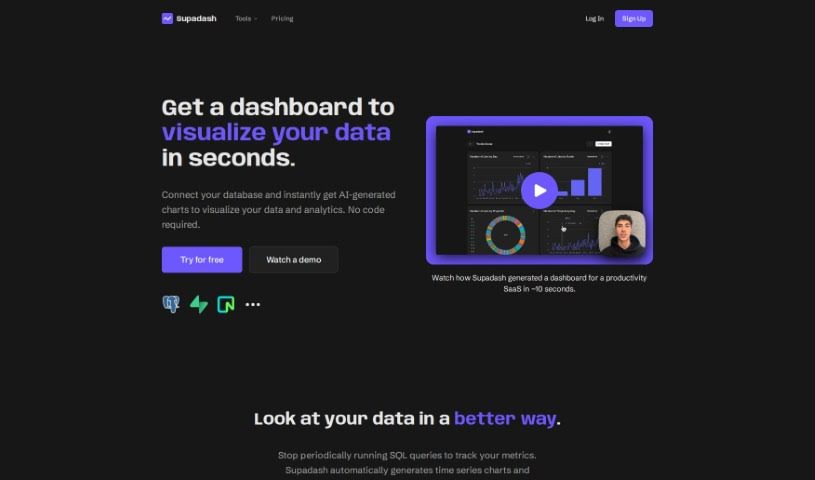
Supadash is your AI-powered assistant for data visualization. It automatically builds data dashboards for you, making the whole process much simpler. You won’t need to write any code or complex SQL queries; Supadash instantly creates charts from your connected databases, like PostgreSQL, or even REST APIs. This means you can easily track key metrics, uncover important business insights, and visualize your data efficiently, all without lifting a finger for manual work.
Who created Supadash?
Supadash was developed by a dedicated team, spearheaded by its founder. The company officially launched on January 29, 2024. Their platform is designed to offer a fast and straightforward way to visualize data using AI-generated charts, completely bypassing the need for coding. By connecting your databases, you can immediately generate visualizations for your data analysis, which really streamlines the entire process and removes the hassle of writing manual SQL queries.
What is Supadash used for?
Supadash is incredibly useful for a variety of tasks:
- It makes data visualization much easier.
- It automatically builds dashboards for you.
- You can easily connect your databases to it.
- It generates charts instantly.
- It helps you get to your business insights faster.
- It smoothly identifies the metrics that matter most.
- It transforms your raw data into clear charts.
- It helps you keep track of your key metrics.
- Data transformation becomes effortless.
- It provides crucial business insights.
- You can build dashboards quickly.
- It offers a wide variety of charts and visualizations.
Who is Supadash for?
Supadash is a great tool for a wide range of professionals:
- Developers
- Founders
- Data Analysts
- Business professionals
- Teams with specific data needs
- Data scientists
- Business analysts
- Marketers
- Product Managers
- Sales professionals
- Project managers
- Software engineers
- Marketing professionals
How to use Supadash?
Here’s a simple, step-by-step guide to get you started with Supadash:
- Connect Your Database: First, sign up on the Supadash website. Then, you can connect your own database to the tool. It works well with PostgreSQL databases and also supports REST APIs for feeding your data.
- Automatic Dashboard Creation: Once your database is linked up, Supadash’s smart AI system immediately generates data dashboards. You don’t need to write any code or SQL queries for this to happen.
- Chart Generation: In just a few seconds, Supadash will create charts and visualizations directly from your connected database. These AI-driven visuals offer quick insights into your data.
- Track Your Metrics: Use the dashboards that Supadash creates to effectively monitor important metrics and key performance indicators for your applications.
- Gain Business Insights: By exploring the visual data representations, you can uncover crucial business insights that will help you make smarter decisions for your company.
- Future Updates: Keep in mind that Supadash is planning to add support for more data sources in the future, which will further expand its capabilities for data visualization.
- Enjoy the Efficiency: You’ll really benefit from the efficiency of this AI-driven system. It simplifies data visualization, offering fast dashboard construction and easy data transformation.
- Compatibility: Right now, Supadash works with PostgreSQL and REST APIs, but as mentioned, they plan to support more data sources down the line. This will make the tool even more versatile for your visualization needs.