Screenshot of Piktochart AI Infographic Maker

Piktochart AI Infographic Maker

Discover what Piktochart's AI Infographic Maker is all about and learn how to use it effectively in 2025. We'll cover its features and how it stacks up against other data visualization tools.

Screenshot

What is Piktochart AI Infographic Maker?

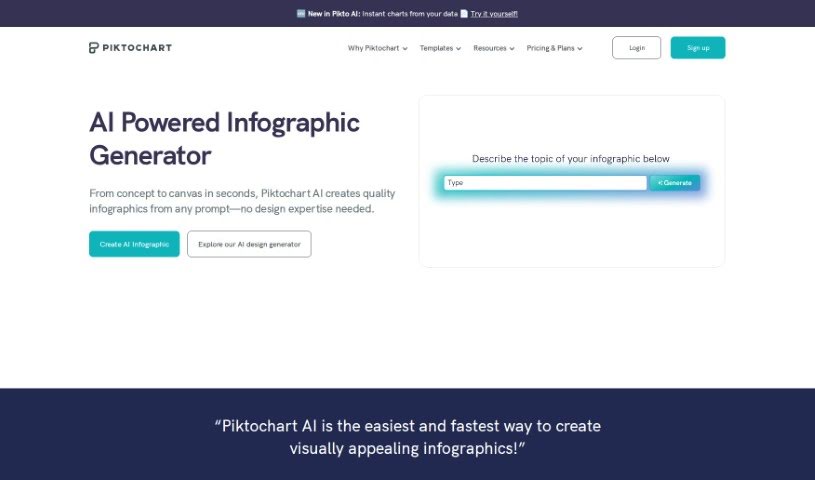
Piktochart AI Infographic Maker is a really user-friendly tool designed to make creating engaging and visually appealing infographics a breeze. It uses artificial intelligence to help you generate high-quality infographics without a fuss. With Piktochart AI Infographic Maker, you get access to a huge library of templates, icons, and design elements, so you can totally customize your creations to fit exactly what you need. The platform has a super intuitive interface, which means even if you’re not a designer, you can still whip up professional-looking infographics for all sorts of things – think presentations, reports, or even social media posts. By tapping into AI technology, Piktochart really streamlines the whole infographic creation process, letting you craft visually captivating content without needing a ton of design experience.

Who created Piktochart AI Infographic Maker?

Piktochart AI Infographic Maker was founded by Lai May Syn, and it first came out on October 22, 2023. The main idea behind creating this tool was to make the whole process of designing infographics much simpler for everyone.

What is Piktochart AI Infographic Maker used for?

This tool is fantastic for creating all sorts of visual content, including:

  • Press Release Infographics
  • Internal Communication Infographics
  • Fact Sheets for Communications
  • Marketing Infographics
  • Educational Infographics
  • List Infographics
  • Guidelines Infographics
  • Fun Facts Infographics
  • Informational Infographics
  • Statistical Infographics

Who is Piktochart AI Infographic Maker for?

Piktochart AI Infographic Maker is a great asset for a wide range of professionals:

  • Marketing specialists
  • Educators
  • Content creators
  • Business analysts
  • Data scientists
  • Project managers
  • Social media managers
  • Nonprofit organizers
  • Sales professionals
  • Graphic designers
  • Event planners
  • Researchers

How to use Piktochart AI Infographic Maker?

Ready to dive in? Here’s a simple breakdown of how to use Piktochart AI Infographic Maker:

  1. Name Your Narrative:
    • First, pick a title for your story – you’ve got up to 120 characters. Something like “Workplace Wellness Trends for 2024” works perfectly.
  2. Select a Template:
    • Take a look through the diverse library of templates. Choosing one can save you a lot of time and give you a great starting point for your design.
  3. Edit in Piktochart Editor:
    • Once you’ve picked a template, just click “Edit Infographic.” This opens up the editor where you can really make it your own. Feel free to tweak and modify elements to perfectly match your style and message.
  4. Add Visual Elements:
    • Make your infographic pop by adding images and icons. The drag-and-drop editor makes this super easy. You can choose from a library of free visual assets or even upload your own to make your infographic truly stand out.
  5. Save and Share:
    • When you’re happy with your creation, save your visual. You can choose formats like PNG or PDF. Then, share it with colleagues, post it on social media, or embed it on your website to inspire others!

Following these steps should help you make the most of Piktochart AI Infographic Maker to create really engaging and informative visuals.

Related AI Tools

Discover more tools in similar categories that might interest you

Stay Updated with AI Tools

Get weekly updates on the latest AI tools, trends, and insights delivered to your inbox

Join 25,000+ AI enthusiasts. No spam, unsubscribe anytime.