What Exactly is NativeBI?
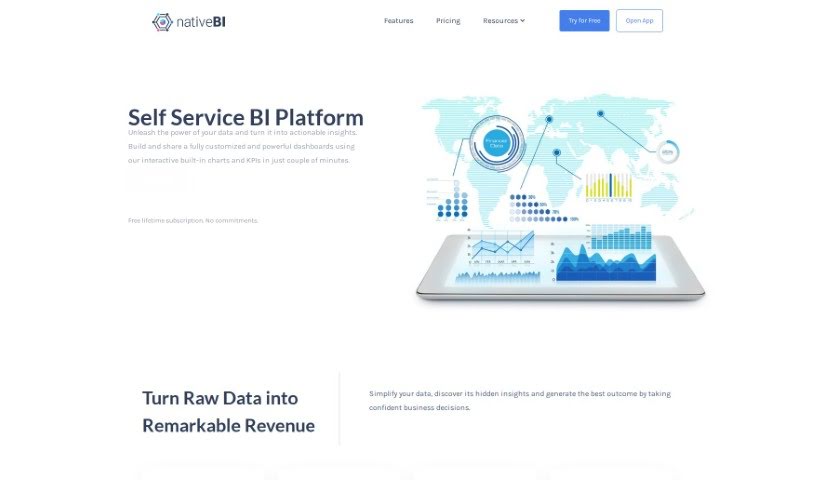
NativeBI is a self-service business intelligence platform. It is a central hub where business leaders can easily visualize, study, and analyze all their company’s data. It’s packed with interactive dashboards, key performance indicators (KPIs), and really useful built-in charts that make digging into your data a breeze.
One of its big strengths is simplifying how you bring data together. NativeBI combines internal and external data sources, connecting smoothly with things like relational databases, spreadsheets, REST APIs, and various cloud data sources. The platform really shines when it comes to data visualization, offering dashboards that are both responsive and interactive, helping you spot those crucial actionable insights.
Plus, NativeBI includes a chat feature, powered by the ChatGPT model, so you can ask questions about your data using plain language for quick analysis. It also has collaboration tools for securely sharing data, and you can have unlimited viewers without any extra charges. They offer flexible subscription plans to fit companies of any size, aiming to turn complicated data into clear, valuable insights that help you make smarter decisions.
Who Created NativeBI?
Richard McClintock and Walhan Bobe are the minds behind NativeBI. They launched the platform on February 27, 2023. Essentially, NativeBI is a self-service business intelligence tool built to give business leaders more power. It does this by offering interactive dashboards, key performance indicators (KPIs), and a chat function specifically for analyzing and visualizing data. The platform connects easily with all sorts of data sources and provides subscription plans that can be tailored to fit different company sizes.
What Can You Do with NativeBI?
NativeBI is designed to help you with a variety of data-related tasks:
- Visualize and analyze your organization’s data all in one convenient place.
- Create interactive dashboards and key performance indicators (KPIs) to track progress.
- Build customized, powerful dashboards quickly using its built-in tools.
- Consolidate data from both internal and external sources for a complete picture.
- Focus on data visualization to uncover those hidden, important insights.
- Perform ad-hoc analysis by simply asking questions using the ChatGPT model.
- Securely share dashboards and reports with your team to foster collaboration.
- Integrate seamlessly with a wide range of data sources, including relational databases, spreadsheets, REST APIs, and cloud data.
- Support an unlimited number of viewers when sharing your reports.
- Offer flexible subscription plans that suit companies of all sizes.
- Empower business leaders by giving them the tools to visualize, study, and analyze their organization’s data from a single location.
- Provide interactive dashboards and KPIs for efficient data exploration.
- Help you build fully customized and powerful dashboards quickly with interactive charts and KPIs.
- Simplify data consolidation by bringing together internal and external data sources for analysis.
- Emphasize data visualization to uncover hidden insights through responsive and interactive dashboards.
- Enable ad-hoc analysis using natural language with its ChatGPT functionality.
- Facilitate collaboration by allowing secure sharing of dashboards and reports within teams.
- Integrate smoothly with various data sources such as relational databases, spreadsheets, REST APIs, and cloud data sources.
- Ensure your data exploration is always up-to-date thanks to a smart data extraction engine.
- Support unlimited viewers for sharing dashboards and reports at no extra cost.
Who is NativeBI Best Suited For?
NativeBI is a great tool for professionals in:
- Consulting
- Data analysis roles
- Finance & Accounting
- Operations Management
- Business Advising
How Do I Use NativeBI?
Getting started with NativeBI is straightforward. Just follow these steps:
- Connect to Your Data Sources: NativeBI makes it easy to connect with major relational databases, spreadsheets, REST APIs, and various cloud data sources.
- Build Dashboards and Reports: You can create interactive dashboards and reports that show up-to-date data from multiple sources all at once.
- Generate Insights: Use the ChatGPT-like interface to analyze your data, get actionable insights, and then securely share them with your team.
- Set Up Notifications: You can define custom business rules to get alerts when your data changes based on specific criteria you set.
- Enjoy All the Features: Take advantage of features like interactive dashboards, a responsive design that works on any device, ad-hoc analysis with ChatGPT, and the ability to share with unlimited viewers.
- Choose Your Subscription Plan: Pick a subscription plan that fits your organization’s size and needs, with options available for startups, medium-sized businesses, and large enterprises.
- Customize and Deploy: You can customize NativeBI to meet your specific requirements with minimal costs. There are also possibilities for on-premise deployments if that’s a better fit for you.
- Get Started Today: Sign up for a free lifetime subscription – no credit card details needed! Start transforming your business with NativeBI.
By following these steps, you can really make the most of NativeBI. It helps you consolidate, visualize, and analyze your organization’s data from all sorts of different sources in a seamless way.