Screenshot of Instachart

Instachart

Discover Instachart in 2025! Learn what this data visualization tool does, how to use its features effectively, and how it stacks up against other data visualization tools.

Screenshot

What is Instachart?

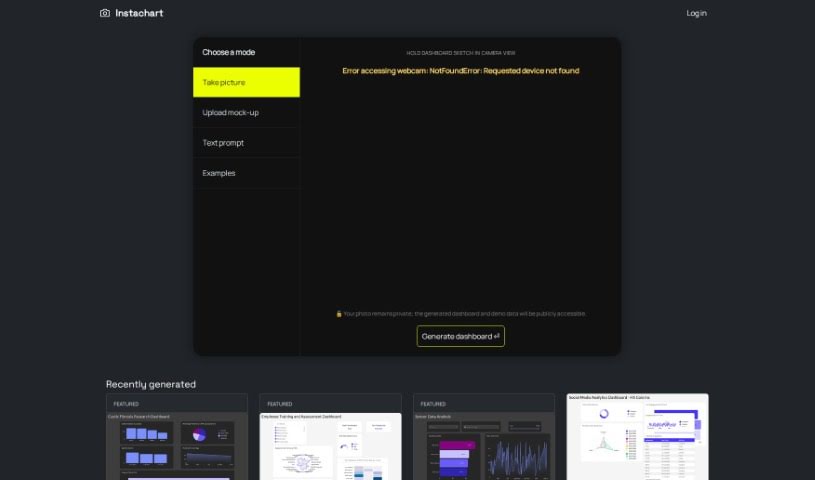
Instachart is a neat tool that helps you turn your sketches, mockups, and even screenshots into interactive dashboards, specifically for Luzmo. You can upload visuals directly on their website or even snap a picture with your device’s camera. This makes it super handy for digging into data and understanding it better, whether you’re looking at cystic fibrosis research, employee training progress, sensor data, or retail sales figures. It’s designed to be easy to use, with a straightforward sign-up process and dashboards packed with features. You can convert your mockups right into dashboards, which is great for many different uses. However, it’s worth noting that it’s currently limited to creating Luzmo dashboards only. We didn’t see any mention of an API, it can’t handle video inputs, and while it uses your device’s camera, it doesn’t offer multiple types of dashboards, real-time data feeds, or extensive customization options.

Who created Instachart?

Instachart was brought to life by a team led by Brian Lee. They officially launched the tool on March 14, 2024. The main idea behind Instachart is to take your visual ideas – like sketches, mockups, or screenshots – and transform them into interactive Luzmo dashboards. It’s built to help you do in-depth data analysis, and you can easily upload visuals to get started. It’s pretty versatile, fitting in with needs across many different industries.

What is Instachart used for?

Instachart is great for a variety of tasks, including:

  • Helping with cystic fibrosis research.
  • Supporting employee training and assessment programs.
  • Analyzing sensor data.
  • Breaking down retail sales figures.
  • Providing an intuitive design experience.
  • Creating feature-rich dashboards.
  • Building interactive Luzmo dashboards.
  • Converting mockups into functional dashboards.
  • Handling various input methods.
  • Making sense of complex data insights.

Who is Instachart for?

Instachart is particularly useful for professionals and researchers in:

  • Cystic Fibrosis Research
  • Employee Training and Assessment
  • Sensor Data Analysis
  • Retail Sales Analysis

How to use Instachart?

Getting started with Instachart is pretty straightforward. Here’s a simple breakdown:

  1. Input Your Data: First, use Instachart to turn your sketches, mockups, or screenshots into interactive Luzmo dashboards. It’s all about transforming visuals into data.
  2. Upload a Screenshot: If you have a visual ready, just use the ‘Upload screenshot’ option right on the Instachart website.
  3. Use Your Camera: Alternatively, you can capture images or sketches directly using your device’s camera for input.
  4. Analyze Your Data: Once your dashboard is generated, you can dive into in-depth data analysis. This is helpful across different fields like cystic fibrosis research, employee training, sensor data analysis, and retail sales.
  5. Explore More Applications: Instachart can be used for many other things beyond these examples, really showing how versatile it is.
  6. Generate the Dashboard: After you’ve uploaded your visuals or captured your sketches, just hit the ‘Generate dashboard’ button.
  7. Sign Up: To get the most out of Instachart, you’ll want to sign up on their website. This gives you access to all the features.
  8. Handling Camera Errors: If your webcam isn’t detected, Instachart will give you an error message, like ‘NotFoundError: Requested device not found’, so you know what’s up.
  9. Try Example Data: Want to get a feel for it? You can explore and practice with example data using the ‘Use example’ option.
  10. Check Out the Features: You’ll find the dashboards are interactive, packed with features, and have an intuitive design that makes understanding your data much easier.
  11. See Dashboard Examples: Take a look at dashboards that have already been created, like the ‘Cystic Fibrosis Research Dashboard’ or the ‘Retail Sales and Stock Dashboard’, to see how it all works in practice.

Instachart really makes it easy to turn visual information into useful insights, thanks to its user-friendly design and powerful features that work across many different industries.

Related AI Tools

Discover more tools in similar categories that might interest you

Stay Updated with AI Tools

Get weekly updates on the latest AI tools, trends, and insights delivered to your inbox

Join 25,000+ AI enthusiasts. No spam, unsubscribe anytime.