1Ptai
Productivity Data Analytics
Learn More
Discover what Graphy App is and how to use it effectively in 2025. We'll explore its features and see how it stacks up against other data visualization tools.
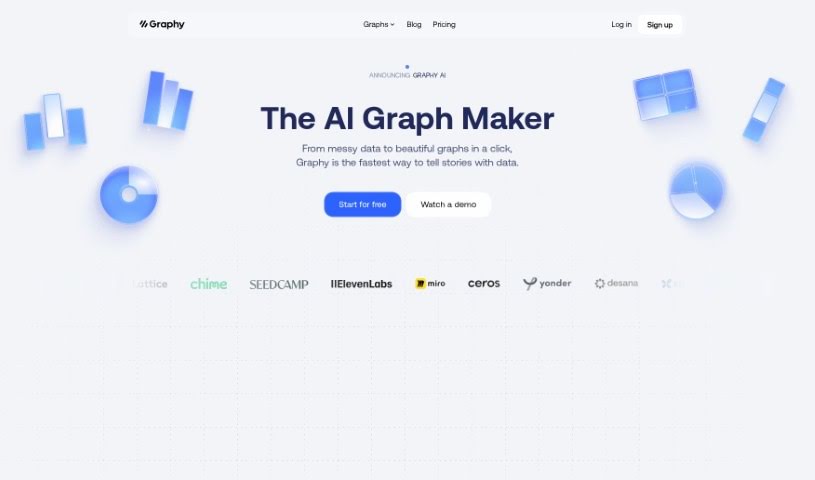
Graphy is a free, AI-powered chart-maker tool that helps businesses create interactive and really slick data visualizations. You get a bunch of different chart options, plus the AI can whip up charts for you super fast. There’s also a handy option to switch to a table view, and you can even embed your charts directly into platforms like Notion. What’s great is that Graphy is really user-friendly; you don’t need any fancy technical skills to get going. It’s designed to help businesses make smarter decisions by turning data into clear, insightful charts, making it easier to understand what your data is telling you and to base your decisions on it. People have been saying good things about Graphy, especially how quickly it creates impressive visuals and makes presenting and communicating data much simpler. The tool works with all sorts of platforms and can display different kinds of data, like your startup’s expenses, how users are interacting with your app, or your customer funnel performance. Essentially, Graphy saves businesses time and money by taking the manual work out of creating charts and reducing the need for specialized staff, all thanks to its AI and easy-to-use design.
Here’s a quick look at the background:
Graphy App was brought to life by Jakob Knutzen and officially launched on May 22, 2023. The company behind it is Graphy Technologies Ltd., and their main goal is to make it simple for anyone to create compelling data visualizations. They’ve got some solid backing from investors like Coatue, La Famiglia, Northzone, and Seedcamp. Graphy App really wants to help people become great at telling stories with data. They do this by making it easy to present and share information through interactive, good-looking charts that are generated with the help of AI. You’ll find a variety of chart types, a straightforward interface, and the ability to embed charts anywhere, all without needing to be a tech wizard. Graphy App has been getting positive reviews for how efficiently it makes charts, how it helps with making decisions, and how it makes it easier for businesses and teams to find insights.
We gathered the details about Graphy App’s founding and company information from the documents provided.
Here’s a simple guide to using Graphy App effectively:
By following these steps, you can really make the most of Graphy’s features to create charts that look good and provide valuable information for your business.
Discover more tools in similar categories that might interest you
Get weekly updates on the latest AI tools, trends, and insights delivered to your inbox
Join 25,000+ AI enthusiasts. No spam, unsubscribe anytime.