What is Columns AI?
Columns AI: A Quick Look
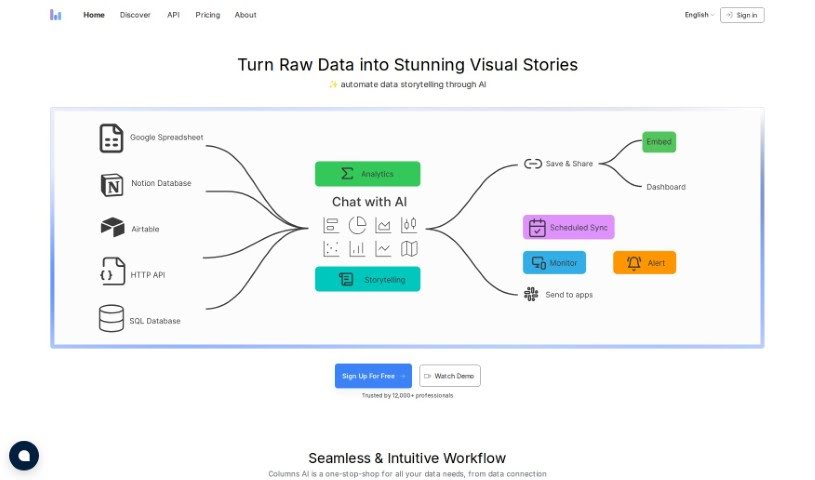
Columns AI is a really neat platform that uses AI to help teams visualize data and work together in real-time. You can create charts and graphs just by typing or even speaking your requests. It also gives you detailed control over who can see what in your data catalogs. The platform comes packed with templates, ready-to-use tools, and ways to connect with other software, all designed to make your data storytelling shine. Plus, it taps into AI, like GPT-3, to understand what you’re asking and respond in a way that feels natural, making your data analysis interactive and easy. Because you can ask questions and create visuals using plain language or your voice, Columns AI offers a super user-friendly way to explore and share data. It supports a huge variety of charts and graphs, makes real-time teamwork a breeze, connects with popular tools like Slack and GitHub, and even lets you tell your own data stories without needing to be a tech wizard. It’s a pretty complete package for any team diving into data.
Who Created Columns AI?
Columns was actually started by Xavier Amatriain. The company behind it, Columns Ai, Inc, launched the platform on May 3, 2023. As we mentioned, Columns is an AI-powered platform focused on data visualization and collaboration, making it simple for teams to team up and create visualizations using natural language or even speech. It offers precise controls for managing your data, and you can access it directly through their website or by integrating it with other tools you already use.
What Can You Do with Columns AI?
Here’s a rundown of what Columns AI is great for:
- Instant Data Visualizations: Get charts and graphs made in a flash.
- Real-time Data Visualization: See your data come to life as you work.
- Seamless Integration: Connects easily with other tools you use.
- Real-time Collaboration: Work together with your team on data projects simultaneously.
- Natural Language Inputs: Ask questions and get answers using everyday language.
- Fine-grained Access Controls: Manage who sees what in your data with detailed permissions.
- Self-Serve Data Storytelling: Create compelling data narratives all on your own.
- Speech-Based Querying: Use your voice to ask questions and explore data.
- Automated Data Interpretation: Let AI help you understand your data better.
- Public Data Access: Easily work with publicly available data.
- Chat with GPT-3: Use GPT-3 directly within Columns for interactive data analysis.
- Wide Template Range: Choose from many pre-made templates to get started quickly.
- Pre-built Visualization Tools: Access tools designed to make creating visuals straightforward.
- Columns uses AI to make data visualization and collaboration easier by understanding and responding to natural language and speech. This means you can ask questions and create visualizations in real-time.
- You can even chat with GPT-3 inside Columns to ask questions and visualize data, which really opens up data analysis for everyone.
- Columns lets you visualize data using natural language and speech. It provides templates, ready-made tools, and design elements to help you craft great data stories.
- With Columns’ detailed access controls, you can securely manage your data catalog, making sure only the right people see sensitive information.
- Columns lets you explore all sorts of data, like finding out which countries have the highest GDP or population, looking at electric car sales forecasts, or checking distances to planets.
- You can create all sorts of charts – bar charts, line charts, scatter plots – using templates that make visualization simple.
- The platform integrates with tools like Slack and GitHub, which is great for collaborating, sharing what you find, and managing data across your team and other platforms.
- Columns empowers you to create your own data stories independently, thanks to its self-serve data storytelling features, so you don’t need to be a tech expert.
- You can share your findings with your team using the collaborative features and integrations with tools like Slack, making it easy to work on visualizations together in real-time.
- Columns uses speech recognition technology, so you can interact with data using voice commands, making the whole experience more intuitive and user-friendly.
- Create all sorts of charts and graphs, including bar charts, line charts, and scatter plots.
- Easily collaborate in real-time and share insights with your team.
- Make your data visualizations even better by adding icons, images, and shapes.
- Create your own data narratives independently with self-serve data storytelling.
- Manage your data catalog securely using fine-grained access controls.
- Use speech recognition technology for a smooth, natural way to interact with data.
- Share insights with your team through collaborative features and integrations with other tools.
- Let AI help interpret and respond to your natural language and speech inputs.
- Integrate with tools like Slack and GitHub to simplify data management and teamwork.
- Query a wide variety of data for different needs.
- Keep your data catalog secure with fine-grained access controls.
- Query data like top countries by GDP or population.
- Create charts such as bar charts, line charts, and scatter plots.
- Integrate with Slack and GitHub for collaboration and data management.
- Tell your own data stories using self-serve data storytelling.
- Use natural language and speech for data visualization.
- Manage your data catalog with detailed access controls.
- Share insights with your team through collaboration and integrations.
- Use speech recognition for intuitive data interaction.
- Combine AI power with user-friendly tools for data visualization and teamwork.
- Create charts and graphs using a wide range of templates and tools.
- Make various chart types like bar charts, line charts, and scatter plots.
- Integrated with Slack and GitHub for collaboration and data management.
- Facilitate real-time collaboration and share insights using Slack.
- Use icons, images, and shapes to make your data stories visually appealing.
- Enable self-serve data storytelling for independent narrative creation.
- Use natural language inputs for querying and visualizing data.
- Chat with GPT-3 for data querying.
- Incorporate speech recognition for intuitive data interaction.
- Query data flexibly.
- Use tools for data beautification.
- A fast platform for data visualization.
Who is Columns AI For?
Columns AI is a great tool for a variety of professionals who work with data:
- Data Storytellers
- Data Analysts
- Data Scientists
- Business Analysts
- Financial Analysts
- Market Researchers
- Data Journalists
- Researchers
- Analysts
- Team Collaborators
- Data Engineers
- Business Intelligence Professionals
- Marketing Analysts
How Do I Use Columns AI?
Here’s a simple guide to getting the most out of Columns:
- Getting Started: First, log in to the Columns platform on their website. You can also connect it with tools like Slack and GitHub to make teamwork smoother.
- Asking for Data: Use everyday language to ask for the data you need – for example, you could ask about the top countries by GDP. You can also use the GPT-3 model for more interactive data analysis.
- Making Visuals: Create your charts and graphs by typing or speaking your requests. Pick from lots of templates and tools, and add icons, images, or shapes to make your data stories more engaging.
- Controlling Access: Use the detailed access controls to manage your data catalog securely, ensuring only authorized people can see sensitive information.
- Connecting Tools: Integrate Columns with other software to boost collaboration, share insights easily, and manage your data across different platforms like Slack and GitHub.
- Telling Your Story: Dive into self-serve data storytelling. You can create your own narratives using the data, querying, visualizing, and sharing it all within the platform.
- Browser Needs: Make sure your browser supports Javascript so you can use all the features Columns offers.
- Voice Interaction: Use speech commands to interact with Columns. This makes data visualization a more seamless and user-friendly experience.
- Stay Updated: Sign up for the newsletter to get tips, best practices, and how-to guides from the Columns community.
By following these steps, you’ll be able to use Columns to its full potential for visualizing data, collaborating with your team, and telling compelling data stories.