1Ptai
Productivity Data Analytics
Learn More
Discover ChartAI in 2025! Learn what this AI-powered tool is, how to use its features effectively, and how it stacks up against other data visualization tools.
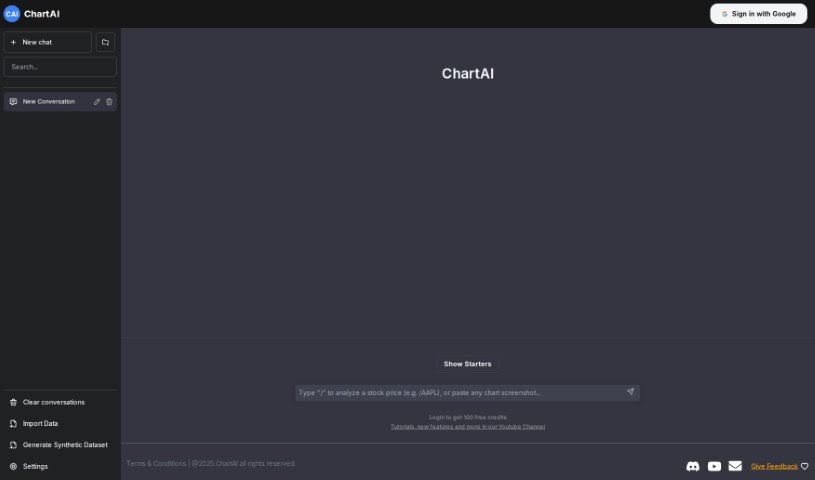
ChartAI is a really neat AI tool built specifically for making charts and diagrams. Thanks to its smart technology and easy-to-use design, ChartAI lets you create eye-catching, informative visuals in just minutes. It’s perfect for anyone – whether you’re in business, crunching numbers as a data analyst, or teaching. ChartAI helps you explain complicated stuff clearly. Just pop in your data, pick a chart style you like, and let ChartAI handle the rest. It’ll look at your data and whip up beautiful, accurate charts that you can tweak to perfectly show what you mean.
What makes ChartAI stand out is how versatile it is. You can create all sorts of charts: line graphs, bar charts, pie charts, scatter plots, and many more. Plus, you have lots of options to customize colors, labels, fonts, and other visual bits to match your brand or just your personal taste. But ChartAI isn’t just for static images! It also lets you add interactive elements like tooltips, zooming, panning, and even animations. This makes it fantastic for building interactive dashboards, reports, presentations, and anything you want to share online visually.
On top of that, ChartAI has some serious data analysis smarts. It can handle big chunks of data, do calculations on the fly, and pull out useful insights. You can easily import data from common formats like CSV, Excel, and Google Sheets, so working with data from different places is a breeze. ChartAI really saves you time and effort when you need to create professional-looking charts. Its straightforward interface and user-friendly design mean anyone can use it, no matter their tech skill level. Whether you’re just starting out or you’re a seasoned data pro, ChartAI offers a smooth and efficient way to get your charts made.
ChartAI was developed by a team of innovators who wanted to create an AI tool that makes generating charts and diagrams super efficient. This tool features an easy-to-use interface powered by advanced technology, and it supports a wide variety of chart types along with plenty of customization options. Beyond just static charts, ChartAI also lets you add interactive features like tooltips and animations. It’s equipped with advanced data analysis capabilities and can import data from various file formats, making it a great choice for users with different levels of technical know-how.
ChartAI is designed to be super user-friendly, making it effortless to create great-looking charts and diagrams. Here’s a simple guide to get you started:
By following these easy steps, you can really use ChartAI to create professional charts and diagrams quickly and effectively.
Discover more tools in similar categories that might interest you
Get weekly updates on the latest AI tools, trends, and insights delivered to your inbox
Join 25,000+ AI enthusiasts. No spam, unsubscribe anytime.