What is Papermoney.ai?
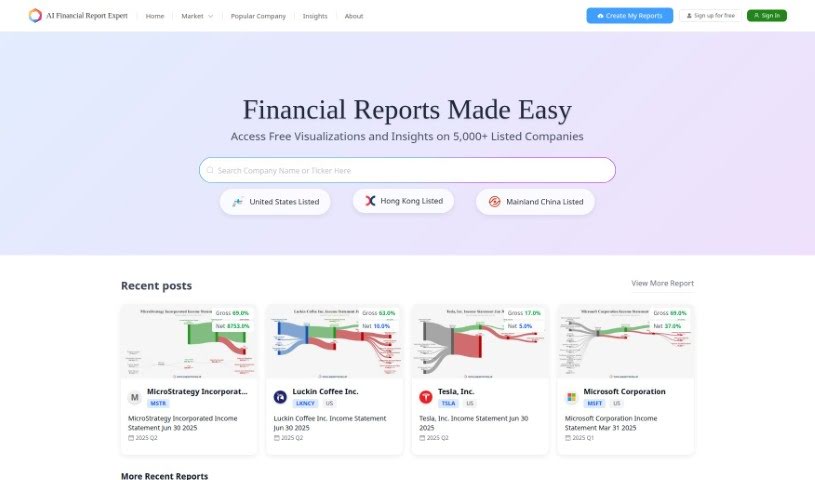
Papermoney.ai is a service designed to help investors, analysts, and anyone interested in business get a clear picture of a company’s financial health, fast. It uses smart AI to turn complex, publicly available financial data into easy-to-understand visual charts. It is getting customized visual breakdowns of income statements, balance sheets, and cash flow statements – all laid out clearly.
To really get a handle on a financial report, you need to look at key parts like the business operations, any risks involved, the actual financial statements, and what management has to say (that’s the MD&A, or Management’s Discussion and Analysis). For example, understanding how a company makes money, what gives it an edge over competitors, where it’s headed strategically, and what potential pitfalls it faces are all crucial steps when you’re digging into its finances.
This service also dives deep into financial insights for over 5,000 companies, including big names like Apple, Amazon, and Tesla. This thorough approach helps investors make smarter choices based on solid data. It’s a goldmine of information, whether you’re a seasoned pro or just starting out in the market. The reports you get are clear, to the point, and well-organized, giving you a solid understanding of a company’s financial standing and where it’s headed.
Who created Papermoney.ai?
The AI Financial Report Analysis platform comes from papermoney.ai. Their main goal is to help investors, analysts, and business folks easily understand a company’s financial well-being by showing them financial data in clear, visual ways. They create custom visual charts for things like income statements and balance sheets, all powered by advanced AI. The platform offers deep dives into financial analysis, real-world case studies, and unique features like trend analysis and AI-driven future predictions. papermoney.ai also provides insights on more than 5,000 companies, including industry leaders like Apple, Amazon, and Tesla. This helps both experienced investors and newcomers make well-informed decisions based on thorough data analysis.
What is Papermoney.ai used for?
- Making complex financial data easy to grasp with intuitive visuals.
- Predicting trends and future outcomes using advanced AI.
- Providing in-depth financial analysis, including insights into how companies operate.
- Helping you understand financial visuals better through practical case studies.
- Delivering detailed analysis reports for over 5,000 different companies.
- Assisting investors and financial enthusiasts in making smart, data-backed decisions.
- Evaluating the financial health and trends of major companies like Apple, Amazon, and Tesla.
- Keeping track of earnings reports and how stocks are performing.
- Gaining a complete understanding of a company’s financial situation.
- Analyzing key financial statements, such as income statements, balance sheets, and cash flow statements.
Who is Papermoney.ai for?
- Energy
- Basic Materials
- Industrials
- Consumer Goods
- Health Care
- Consumer Services
- Telecommunications
- Utilities
- Financials
- Technology
How to use Papermoney.ai?
Here’s how to get the most out of the AI Financial Report Analysis tool:
- Get to know the 10-K Report: Think of a 10-K report as a company’s annual check-up, submitted to the SEC. It gives you a full picture of its financial health, its game plan, and any risks it might face. It really lays out the company’s operations and market risks.
- Navigate the Key Sections: A 10-K report is broken down into specific parts: Business, Risk Factors, Financial Statements, Management’s Discussion & Analysis (MD&A), and Notes to Financial Statements. Each part offers unique insights into different aspects of the company.
- Analyze Business Operations: Pay close attention to the Business section to understand what the company actually does, where its money comes from, what makes it stand out from competitors, and what its strategic goals are.
- Assess Risk Factors: Figure out the risks and challenges the company is up against – whether they’re operational, financial, regulatory, or market-related. This helps you see where the company might be vulnerable.
- Review Financial Statements: Look at the numbers to understand the company’s profitability, its ability to meet its debts, and its cash flow. Check out revenue trends, profit margins, how much debt it carries, and how efficiently it manages its assets.
- Examine MD&A: This is where management talks directly about the company’s financial results, how it’s executing its strategy, what it expects for the future, and any challenges it sees. It’s a great place for qualitative insights.
- Study Notes to Financial Statements: Don’t skip the notes! They often contain important details about accounting methods, potential future costs (contingencies), ongoing legal issues, and other supplementary information that can really deepen your analysis.
- Use the AI Technology: Take advantage of the tool’s advanced AI for trend analysis, making predictions about the future, and getting clear, visual representations of complex financial data.
- Explore Case Studies: Use the case studies available in the tool to get a better feel for financial visuals and see how they apply in real-world situations.
- Stay Updated and Informed: Keep up with the latest financial news, stock performance, and industry trends by using the up-to-date reports and analyses provided by the AI Financial Report Analysis tool.
By following these steps and using the tool’s features, you can really get a handle on a company’s operations, its financial health, and what’s happening in the market. This will help you make smarter investment choices and strategic business decisions.